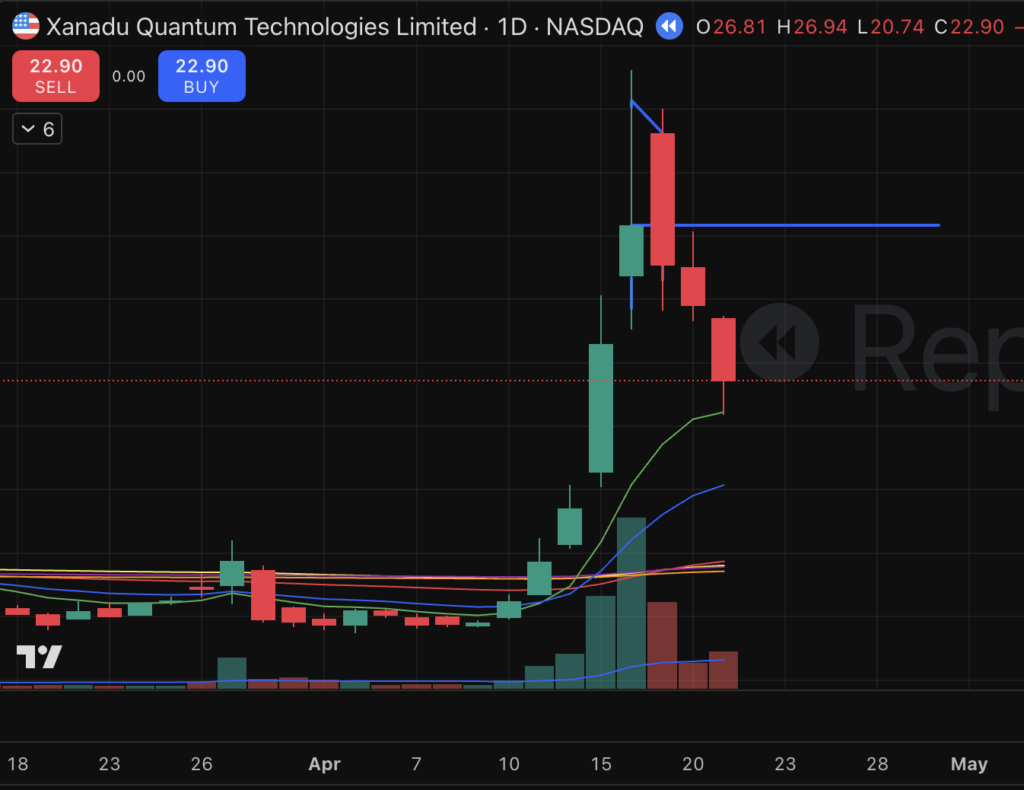
XNDU surged nearly 250% in just three trading days, creating a classic parabolic extension far above its short-term moving averages.
On the third day of the move, price printed a large upper wick, signalling early signs of exhaustion and the emergence of sellers into strength. After multiple days of aggressive upside, this type of price action often reflects supply beginning to overwhelm demand.
The following session opened within the range of that upper wick and immediately sold off, confirming the shift in momentum. Over the next three days, price declined roughly 40% from the open, validating the exhaustion signal from the prior session.
Intraday Context (5-Minute Chart)
Looking at the 5-minute timeframe for the day prior to the sell-off and the day of the reversal:
- The final day of the move showed increasing volatility and failure to hold highs, with repeated rejection at elevated levels
- On the day of the reversal, price failed to reclaim early strength and quickly broke down, offering intraday confirmation of weakness
- Once momentum flipped, downside continuation was relatively clean, with limited support due to the prior vertical move
- Volume expanded significantly on the sell-off day, marking the highest volume of the move and reinforcing the shift from demand to supply
Key Characteristics of the Setup
This move highlights several common traits of parabolic short setups:
- Extreme short-term extension after multiple consecutive up days
- Climactic volume and volatility near the highs
- Upper wick / rejection candle signalling supply
- Gap or weak open into prior exhaustion range
- Heaviest volume coming in on the sell-off day